I recently discovered the “SUMIFS” formula in Excel that I think you’ll like because it makes it easy to select specific data from a data list in Excel. Excel Reports for GP is a great way to extract data from Dynamics GP and report on it. Because the resulting Excel spreadsheet includes a data connection to the GP database, you can format the spreadsheet and refresh the data as you wish.
Typically I have used the pivot chart, and graph functionality in Excel to create the reports I want. But the “SUMIFS” formula allows me to have more control over the reported results and format. This is how I generally use the formula:
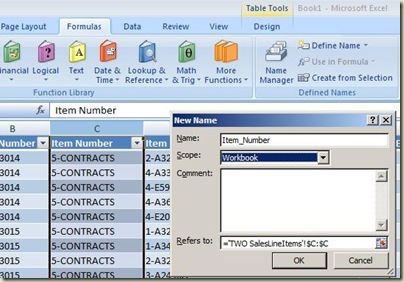
Define range names for the data you want to report on. In Excel:
- Select the column with the data you wish to name
- Formulas >> Define Names
Image may be NSFW.
Clik here to view.
Enter the formula to select the data you want:
- Select the range that includes the data you want (e.g. Extended_Price)
- Select the range that includes the values you will select
- Select the specific value that corresponds to the data you want to display
Image may be NSFW.
Clik here to view.
The result:
Image may be NSFW.
Clik here to view.
See the formula in the formula bar on top. In this case I used a relational reference to the criterion I used, B17.
Try it out. It will give you a lot of control over the data you can select and how it is formatted.
Image may be NSFW.
Clik here to view.![]() Image may be NSFW.
Image may be NSFW.
Clik here to view.![]() Image may be NSFW.
Image may be NSFW.
Clik here to view.![]() Image may be NSFW.
Image may be NSFW.
Clik here to view.![]() Image may be NSFW.
Image may be NSFW.
Clik here to view.![]() Image may be NSFW.
Image may be NSFW.
Clik here to view.![]() Image may be NSFW.
Image may be NSFW.
Clik here to view.![]() Image may be NSFW.
Image may be NSFW.
Clik here to view.![]() Image may be NSFW.
Image may be NSFW.
Clik here to view.![]() Image may be NSFW.
Image may be NSFW.
Clik here to view.![]()
